Enterprise Recon Cloud 2.12.1
How To View Server Information
This section covers the following topics:
Check Master Server Details
The System > Server Information page displays the following information about the Master Server:
| Section | Displays |
|---|---|
| Master Host/ Master Version/ Master Public Key |
|
| Server Time | Displays Master Server system clock.
Scan schedules by default depend on your Master
Server's system clock. If your Master Server's system clock does not
match a Node Agent's system clock, your scans will not run as scheduled.
To change the time shown here, refer to Set Time Zone in the Manage Master Server section. |
| Backup | Displays the active backup policy and the status of recent backups.
Refer to Use Automated Backup in the Create Backups. |
| System Load | Displays the Master Server system load. Refer to View System Load Graph below. |
| System Services | Displays the status of system services on the Master Server. |
Create Backups
There are three methods to create backups of the Master Server:
- Create an Amazon EBS Snapshot (recommended)
- Use Automated Backups
- Use Manual Backups
Refer to the Create Backups section.
View System Load Graph
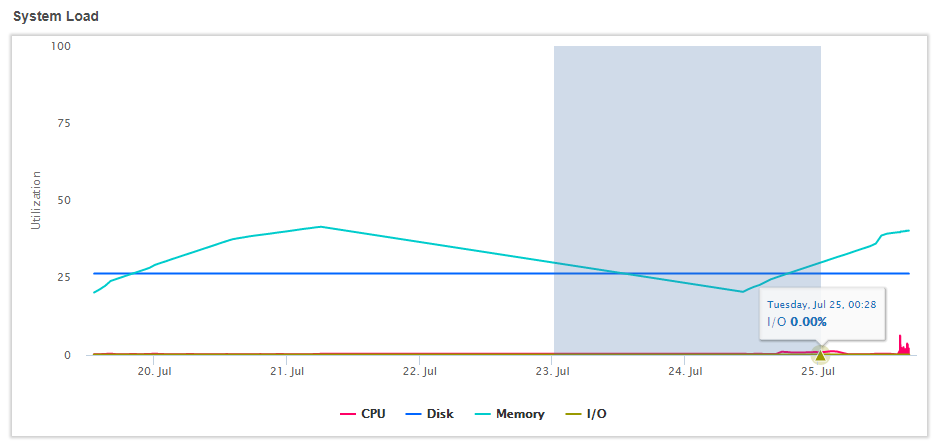
On the System > Server Information page, you can view a graph of the Master Server system load against time.
The graph's legend indicates the system load type shown and the corresponding color on the graph.
To view and download a log of the system load statistics in a CSV file format, click Download Statistics.

To view details on a statistic, pause on a point on the line graph to view the statistic utilization percentage and the exact time stamp.
For example, the above image displays the memory usage for Wed, Jun 21 at 14:23.
Read the Graph
The following table describes the statistics shown for both the graph and CSV file:
| Graph value | CSV column | Description |
|---|---|---|
| (x axis) | Time stamp | The system load's statistics are recorded every 10 seconds. Statistics older than an hour are then averaged down to hourly records. In the CSV file, the records are sorted from oldest to newest. |
| CPU | CPU Usage % | CPU usage refers to your computer’s processor and how much work it's doing. A high reading means your computer is running at the maximum level or above normal level for the number of applications running. |
| Memory | Memory Usage % | Percentage of memory used by all running processes on the Master Server host machine. |
| Disk | Disk Usage % | Percentage of disk space that is currently in use on the Master Server. |
| I/O | Disk I/O % | Any operation, program, or device that transfers data to or from a computer. Typical I/O devices are printers, harddisks, keyboards and mouses. |
Customize the Graph
You can toggle the visibility of each statistic charted on the graph. By default, all the line graphs are shown.
To hide a statistic, click the statistic's line graph or the statistic type in the legend. When hidden, the statistic type in the legend is dimmed.

To view statistics for a set date or time period:
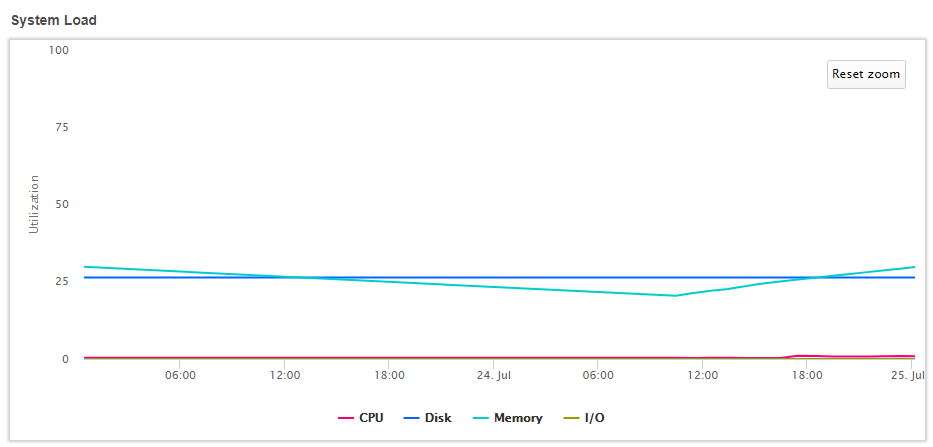
- Go to the System Load Graph. Move your mouse to the desired start date.
- Click and drag the mouse to the desired end date.

- To return to the original graph, click Reset zoom.
